Netrivo guide
Ecommerce profitability analytics
Revenue is not profit. Netrivo brings supported costs together and keeps missing evidence visible.
From sources to the store result
- 01
Sales
Orders, discounts and returns retain their period, currency and source.
- 02
Costs
COGS, fees, payments, shipping and advertising enter only from available evidence.
- 03
Coverage
A missing mapping or cost remains a gap rather than becoming zero.
- 04
Result
Contribution layers show which data scope supports the decision.
What the result actually measures
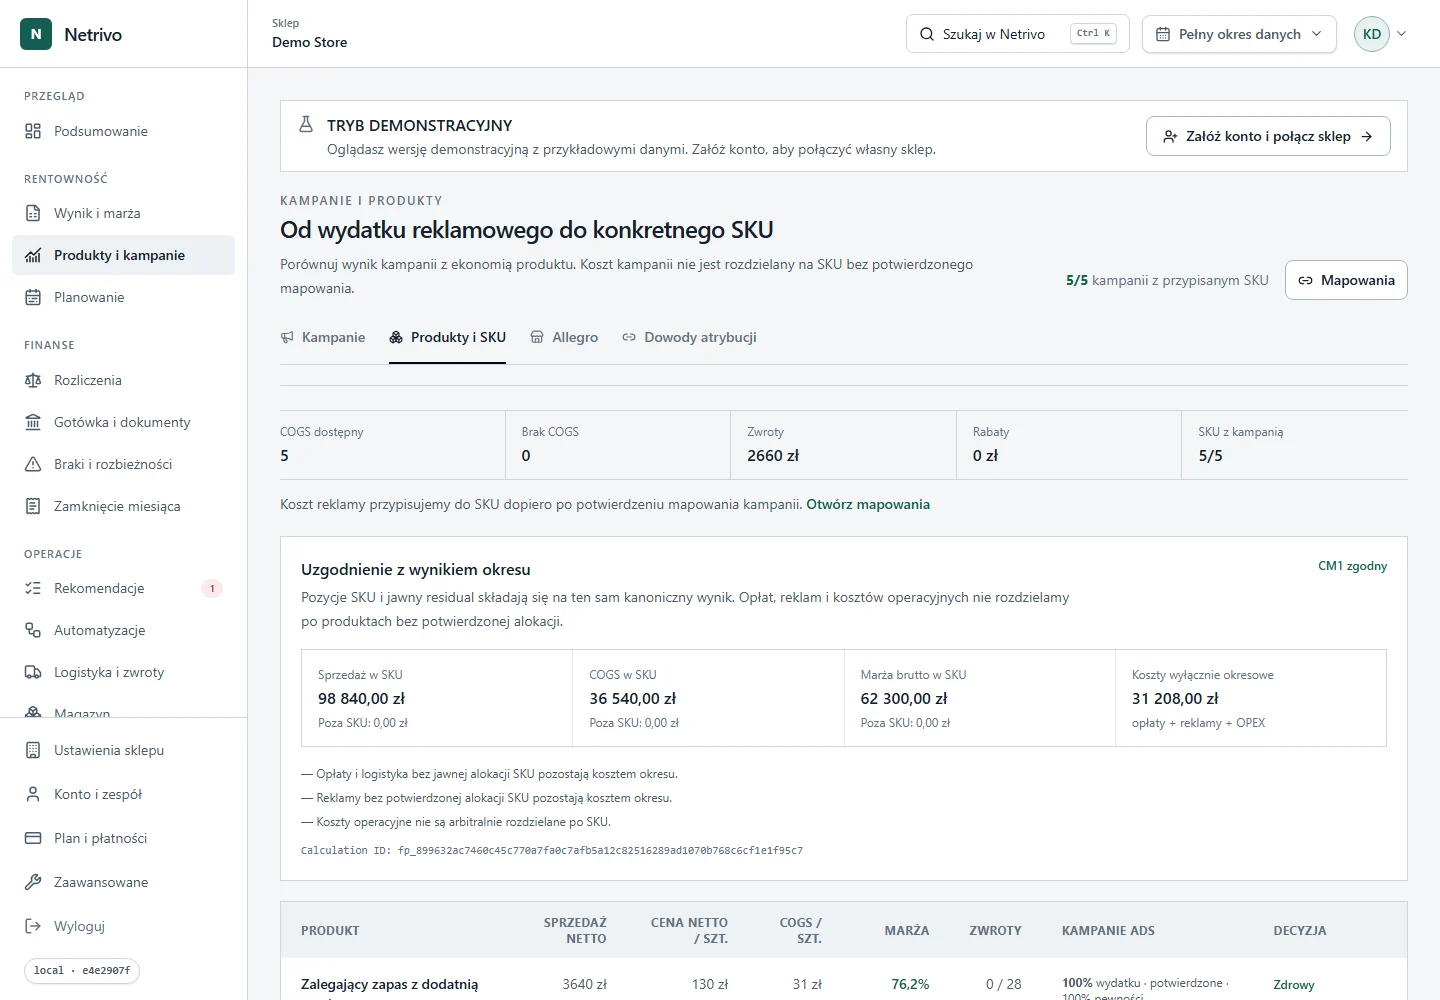
Revenue does not show what remains after a sale. The first useful result layer needs at least orders and product cost. Fees, payments, shipping, returns and advertising are deducted only when a source and a supported assignment exist.
Netrivo separates contribution layers. A partial layer is not presented as net profit or an accounting result.
- CM1: sales after product cost
- CM2: CM1 after selling costs
- CM3: CM2 after attributed advertising
Minimum evidence set
Every number needs a period, currency and provenance. Missing cost, FX or SKU mapping evidence remains visible instead of being converted to zero.
Coverage shows whether a result can support a decision or should first be used to close a data gap.
- orders and returns
- historical or assigned COGS
- fees, payments and shipping
- advertising spend and attribution scope
How to use the result
Compare periods and segments only after checking that they have comparable coverage. A change can reflect economics or merely a newly available cost source.
Netrivo supports operational control. Tax reporting, statutory accounting and final net profit remain accounting responsibilities.